

Microsoft announced a new UI Performance Analysis tool for WPF apps in Visual Studio 2015 CTP 5.
New
Timeline tool is a replacement for the existing XAML UI Responsiveness
tool available in Visual Studio 2013. The tool can be used for WPF (.NET
4.0 and above) and Windows Store 8.1 applications running on Windows
8.1 or later.
Customers expect
applications to load fast and this new timeline tool will help to
achieve that with semantically-rich, scenario centric view of your
applications’ resource consumption.
Open
the Performance and Diagnostics hub from the Debug -> Start
Diagnostic Tools Without Debugging (ALT+F2) menu. Select the Timeline
tool and click Start (You can also run the CPU Usage tool alongside the
Timeline tool). This launches the application in the profiler. Once you
exercise the scenario that you’d like to investigate, you can stop the
profiling session by clicking on the Stop Collection link, which starts
the analysis of the collected performance data.
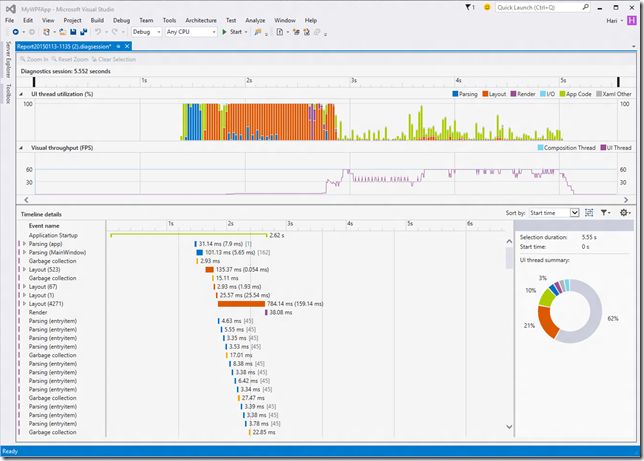
Report can be analyzed for optimization opportunities.
Detailed information about application optimization using the tool is available here >>
No comments :
Post a Comment